


Aligned or At Odds? A Review of Executive Pay
“Incentives are like jet fuel — they speed things up, but if they’re pointed in the wrong direction, you’ll crash faster.”
– Adam Grant, Professor and Author
This past quarter was marked by ‘proxy season’, the time of year when companies open their doors to shareholder scrutiny through Annual General Meetings (AGMs). Troy’s Investment Team has cast 1,258 votes at 68 company meetings so far, weighing in on a wide range of proposals. As outlined in last year’s report Election Mania and AGMs, our voting process is thoughtful and focused on long-term interests. This quarter, we turn our attention to one of the most consistently important and hotly debated issues on the ballot which we evaluate every year: executive pay.
How a company rewards its leaders sends a clear signal about its priorities. Well-designed incentives promote long-term thinking, align management with shareholders, and focus attention on what really drives sustainable performance. Poorly designed pay structures, on the other hand, can encourage short-termism, reward luck over skill, or worse – pay for failure.
At Troy, we are selective about the companies we invest in. We look for competent, aligned leadership, often reflected in thoughtful pay structures that incentivise long-term value creation. But even among high-quality businesses, there can be room for improvement. In this report, we share our perspectives on what good remuneration looks like, and where policies fall short. We highlight examples of the pay practices that earned our support, and those that gave us cause for concern.
What Makes ‘Good’ Remuneration?
There is no universal formula for executive pay. The right structure depends on a company’s sector, strategy, growth profile and capital requirements. That’s why we evaluate each remuneration policy on its own merits, applying careful judgment and considering the broader context. Even so, we believe all well-designed pay structures share a few core principles:
- Long-term focus: Pay should prioritise long-term performance over short-term results. We look for a meaningful weighting toward incentives measured over periods of three years or more.
- Pay for performance: Compensation should be tied to metrics that management can influence — such as organic growth, free cash flow, and return on capital. Non-financial targets should be clearly defined and used carefully to avoid subjectivity.
- A high bar: To justify high rewards, performance goals must be genuinely stretching. Benchmarks and peer comparisons should be thoughtfully chosen and robust.
- Skin in the game: Executives should hold shares for the long term to align with shareholders; we favour equity over options and support meaningful holding requirements.
- Keep it simple: Remuneration structures should be clear, transparent, and easy to understand — for both investors and employees.
- Right-sized rewards: Competitive industries may warrant higher pay to attract and retain talent, but packages must be proportionate, performance-linked, and not risk eroding stakeholder trust.
Aligning Pay with Performance
Halma
Halma’s remuneration policy is very well designed, with a clear link between performance and shareholder value. CEO Marc Ronchetti receives a base salary of £940,500 and a short-term bonus of up to 200% of this (two-thirds in cash, one-third deferred shares).
The short-term incentive is 90% weighted to a single performance metric: Economic Value Added (EVA). The remaining 10% is linked to diversity and climate-related goals. EVA performance is assessed against a three-year weighted average target.
Figure 1
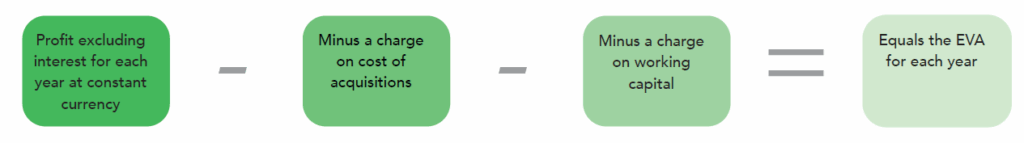
Source: Halma Company Reports
EVA is uncommon in remuneration structures, but we think it works well as it combines an absolute £ measure of profit while taking into account the cost of capital. Essentially, EVA accounts for both appropriately high returns on capital and profit growth, which in our view should link closely to shareholder value creation.
While EVA is not always the most intuitive or easily understood metric, particularly compared to simpler profit-based measures, in Halma’s case it works, offering a more precise gauge of value creation across a decentralised group structure.
Halma’s long-term incentive plan covers similar bases. It can be up to 300% of base salary and is entirely awarded in shares. Performance is measured 50% on three-year earnings per share growth and 50% on three-year average Return on Total Invested Capital (ROTIC). Earnings per share (EPS) ensures the policy will penalise for any share issuance (such as using equity for acquisitions).
The combination of EVA, ROTIC, and EPS growth mean Halma’s management are strongly incentivised to observe capital discipline while still being incentivised to grow over both the near and long term. Observing appropriately high returns on invested capital is particularly important in Halma’s case, as they are a serial acquirer of small businesses, deploying large amounts of capital every year to grow inorganically.
On top of the rigorous performance measurement, the CEO must also hold at least 300% of their base salary in Halma shares. In our view, the overall remuneration structure has worked well for many years and we continue to support their approach. There are always potential improvements; for example, seeing an explicit metric for revenue growth would ensure that profits/ EPS cannot be boosted simply by increasing margins (which may mean management are underinvesting). In Halma’s case, high-quality management and a suite of rigorously tracked internal Key Performance Indicators (KPIs) (which include revenue growth and reinvestment into Research & Development) have ensured strong alignment and value creation for shareholders.
Incentive Misfires
Alphabet
Alphabet’s pay structure raises several concerns, beginning with the infrequent opportunity for shareholder input. The company does not hold an annual ‘Say on Pay’ vote, instead offering shareholders the opportunity to vote on executive compensation only once every three years. This weakens accountability and limits shareholder oversight.
The structure of the pay package itself is also lacking. Our concern with Alphabet’s pay practices lies in the unusual pattern of pay awards and the nature of the incentives. The majority of CEO Sundar Pichai’s compensation is delivered through stock-based awards, granted only once every three years. The most recent grant in 2023 was valued at $198 million, equating to an average of $66 million per year — a figure that far exceeds the median pay of peers at $50 million.
The grant is structured as follows:
- 40% awarded in restricted stock, which vests quarterly over three years. This portion is entirely time-based, rewarding tenure rather than performance.
- 60% awarded in performance stock units (PSUs), tied to Alphabet’s Total Shareholder Return (TSR) relative to the S&P 100, measured over a two- and three-year window.
We have two main concerns with this structure. The first is the overreliance on TSR. While TSR aligns with shareholder outcomes, it is a single external metric that poorly captures underlying business performance. TSR can be heavily influenced by market trends, momentum, or macroeconomic conditions, rather than management’s execution or long-term value creation. When combined with large time-based stock awards, it means a significant portion of Sundar Pichai’s compensation is driven by factors outside his control – in effect rewarding him for showing up to work rather than delivering results. A more balanced plan would incorporate operational or strategic metrics that reflect the health and direction of the business, such as revenue growth targets to capture future growth potential, and earnings per share targets to strengthen financial discipline.
Our second concern is with how Alphabet structures its stock awards. Instead of smaller annual grants, the company gives its CEO one very large award every three years. This setup increases the risk of windfall payouts where strong performance during a specific period triggers a massive reward, even if the company underperforms thereafter. This was the case when the awards were made in 2023. The grant cycle means there is no performance review for three years, so poor results go unaddressed in the meantime. Annual grants allow for more frequent check-ins and better alignment with actual performance.
Overall, the structure fails to reflect a strong pay-for-performance philosophy and limits shareholder oversight by tying compensation to narrow metrics and infrequent performance reviews. At Alphabet’s AGM this quarter, we opposed the triennial ‘Say on Pay’ frequency, voting in favour of an annual vote. We also voted against the appointment of the Chair of the Compensation Committee, given our continued concerns with the design and magnitude of executive pay.
The Bottom Line
“Incentives shape behaviour more than intentions do.”
— James Clear, Author
Over the course of this proxy season, we have seen a wide range of executive pay packages, from the exemplary to the questionable. While we do not make a habit of voting against remuneration proposals, we are clear in our expectations. In most cases, we prefer to engage directly with companies and their remuneration committees rather than escalate through a vote, unless necessary. Troy currently has four active engagements open on remuneration-related issues with portfolio companies.
American Express is an example of such an engagement. The pay plan is generally well-structured, but we remain concerned about whether one of the long-term performance targets is sufficiently stretching. Specifically, we question the appropriateness of the peer group used to benchmark Return on Equity, which may make it too easy for management to outperform. We have engaged on this issue since 2021 and voted against the pay proposal for five consecutive years. Our dialogue with the company is ongoing, as we continue to advocate for stronger alignment between reward and genuine outperformance.
Striking the right balance between growth, profitability, and strategic goals is difficult, but what should not be difficult is clarity. We value pay structures we can understand, and that is a baseline we are not willing to compromise. Well-designed incentives shape behaviour, direct focus, and drive outcomes. That is why we remain committed to keeping companies honest on pay and encouraging better practices, because when incentives are aligned, everyone benefits.
Disclaimer
Further information relating to how ESG integration is applied to the fund can be found in the fund prospectus and investor disclosure document. For further information relating to Troy’s approach to company voting and engagement, please see Troy’s Responsible Investment and Stewardship Policy available at www.taml.co.uk.Please refer to Troy’s Glossary of Investment terms here. The document has been provided for information purposes only. Neither the views nor the information contained within this document constitute investment advice or an offer to invest or to provide discretionary investment management services and should not be used as the basis of any investment decision. The document does not have regard to the investment objectives, financial situation or particular needs of any particular person. Although Troy Asset Management Limited considers the information included in this document to be reliable, no warranty is given as to its accuracy or completeness. The views expressed reflect the views of Troy Asset Management Limited at the date of this document; however, the views are not guarantees, should not be relied upon and may be subject to change without notice. No warranty is given as to the accuracy or completeness of the information included or provided by a third party in this document. Third party data may belong to a third party.Past performance is not a guide to future performance. All references to benchmarks are for comparative purposes only. Overseas investments may be affected by movements in currency exchange rates. The value of an investment and any income from it may fall as well as rise and investors may get back less than they invested. The investment policy and process of the may not be suitable for all investors. Tax legislation and the levels of relief from taxation can change at any time. References to specific securities are included for the purposes of illustration only and should not be construed as a recommendation to buy or sell these securities.
Although Troy’s information providers, including without limitation, MSCI ESG Research LLC and its affiliates (the “ESG Parties”), obtain information from sources they consider reliable, none of the ESG Parties warrants or guarantees the originality, accuracy and/or completeness of any data herein. None of the ESG Parties makes any express or implied warranties of any kind, and the ESG Parties hereby expressly disclaim all warranties of merchantability and fitness for a particular purpose, with respect to any data herein. None of the ESG Parties shall have any liability for any errors or omissions in connection with any
data herein. Further, without limiting any of the foregoing, in no event shall any of the ESG Parties have any liability for any direct, indirect, special, punitive, consequential or any other damages (including lost profits) even if notified of the possibility of such damages. All reference to FTSE indices or data used in this presentation is © FTSE International Limited (“FTSE”) 2025. ‘FTSE ®’ is a trademark of the London Stock Exchange Group companies and is used by FTSE under licence. Issued by Troy Asset Management Limited (registered in England & Wales No. 3930846). Registered office: 33 Davies Street, London W1K 4BP. Authorised and regulated by the Financial Conduct Authority (FRN: 195764) and registered with the U.S. Securities and Exchange Commission (“SEC”) as an Investment.
Adviser (CRD: 319174). Registration with the SEC does not imply a certain level of skill or training.
© Troy Asset Management Limited 2025