


Through a Glass Darkly
To many in the investment world, dynamic asset allocation is seen as a dark art. It is often dismissed as something not to be attempted. In a world that extols the merits of ‘buy and hold’ and ‘time in the market, not timing the market’, dynamic asset allocation is much misunderstood. To us, asset allocation is not about market timing but rather is a helpful tool to mitigate and diversify risk.
For the past 24 years, Troy’s Multi-Asset Strategy has sought to protect and grow our investors’ capital. It is not appropriate for such a mandate to hold 100% in equities. Since the mandate’s launch in 2001, we have experienced three major equity market drawdowns, two of 50% (the dot-com bust and the global financial crisis) and one of 35% (the pandemic). These are painful events that our investors do not wish to experience and desire protection from. Our investors also want to recover losses quickly and make new highs. We aim to deliver consistency of returns. Whilst the Strategy, which is long-only, will not deliver positive returns in every environment, its drawdowns have been much less than those of the market (see Figure 1).
Figure 1: Troy’s Multi-Asset Strategy – Maximum Drawdown
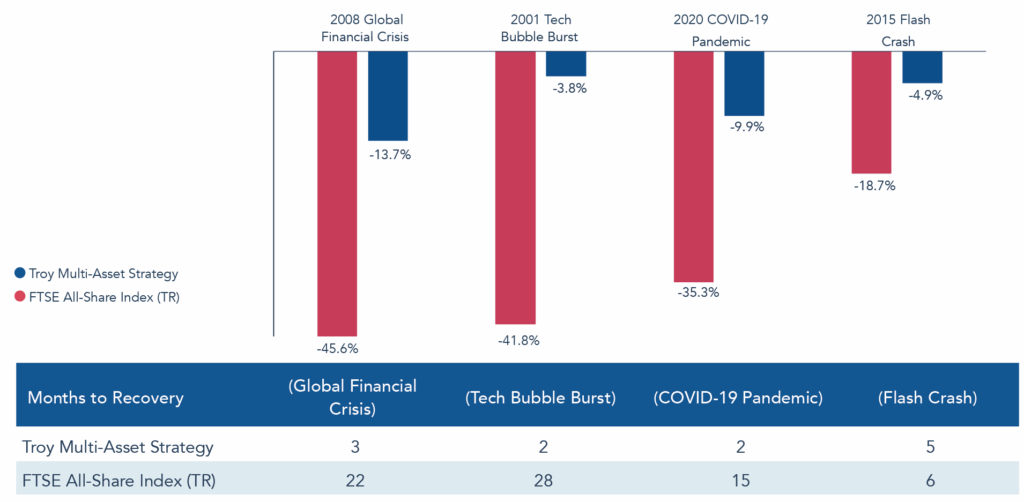
Source: FactSet, since launch 31 May 2001 to 30 June 2025. Past performance is not a guide to future performance. All references to benchmarks are for comparative purposes only.
The objective
Troy’s Multi-Asset Strategy was established for the Weinstock Family in 2001, seeded by the capital of Troy’s co-founder Arnold Weinstock. At the end of his career, Lord Weinstock was clear that his capital could not be replaced. The mandate was to preserve capital first, and to grow it second. The time horizon was long, with this wealth to be protected for future generations.
The caution embedded in Troy’s approach is also informed by the context of when the business was founded. The fate of General Electric Company (later Marconi), which Arnold Weinstock had run successfully for over 30 years, was formative. After Lord Weinstock’s retirement in 1996, new management took on leverage to make a series of large acquisitions. As the dot-com bubble burst, this ultimately led to the company’s restructuring and demise.
With this backdrop, Lord Weinstock was clear in his brief. Capital preservation and growth are absolute, not to be achieved relative to benchmarks. The success of the mandate would be judged on its ability to compound ahead of inflation over time as well as on the consistency of that growth. As such, drawdowns comparable with the market’s would not be tolerated. This is how we run the mandate today, clear that compounding is made simpler if you can minimise the downside. The result has been high single-digit annualised returns since inception (see Figure 2). Going forward, we must achieve something similar whilst remaining competitive ahead of both inflation and the risk-free rate.
Figure 2: Troy’s Multi-Asset Strategy – Performance
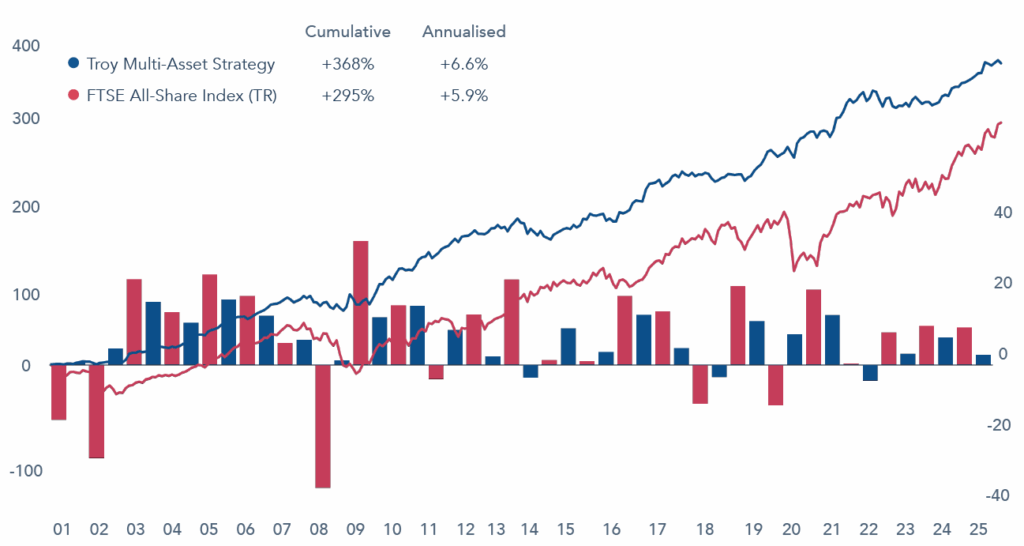
Source: FactSet, since launch 31 May 2001 to 30 June 2025, net of fees. Past performance is not a guide to future performance. All references to benchmarks are for comparative purposes only. The information shown relates to a mandate which is representative of, and has been managed in accordance with, Troy Asset Management Limited’s Multi-Asset Strategy.
Asset allocation framework
In order to succeed, you must first survive.
– Warren Buffett
The Strategy’s asset allocation framework is informed by this objective to protect and grow. To meet this successfully, it is helpful to examine first what failure looks like. With asset allocation, the possible roads to failure are many but there are two common mistakes. The first, which applies to most aspects of investing but particularly to asset allocation, is the temptation to embrace complexity. The inclusion of more complex securities, which hold the promise of differentiated returns (alternatives), often comes at the cost of liquidity, predictability and higher expenses. The second common pitfall is a desire to assume risk pro-cyclically, chasing markets as they rise and divesting as they fall. We have endeavoured to establish a framework to counter both these biases.
Keep It Simple Stupid
In engineering, complex systems are more prone to errors, harder to maintain, and less user friendly. This was the premise behind the design principle KISS (‘Keep it simple stupid!’) pioneered by the US navy in 1960. The same applies to investing. We stick to asset classes that we and our clients can understand which provide sufficient flexibility to protect capital across a range of environments. These constitute the four pillars of the Multi-Asset Strategy: equities, bonds, gold and liquidity. Equities are a central point of control and the means through which we take market risk. The other asset classes exist to protect when equities cannot, and to provide dry powder to lean into stocks when valuations fall.
We are long-only by design. Shorting the market or seeking protection via derivatives can be costly without flawless market timing. Great businesses have time on their side; betting against them is a fool’s errand. Investing in these businesses has, in our experience, been the best way to preserve and grow capital over the long run. When we perceive heightened risks to equity markets, such as excessive valuations, we will increase our exposure to protective asset classes. Whilst this approach means that we will not capture all the upside of a bull market, it also means that we have still tended to generate attractive absolute returns during such periods.
The non-equity asset classes that we favour are highly liquid with a track record of holding up during market declines. Within bonds, we favour liquid, developed-market government debt. In gold, we tend towards physically backed exchange-traded commodities. And our liquidity is invested in nominal, developed-market government bonds with a duration of two years or less. Not all will be inversely correlated with stocks; liquidity for example can at most retain its nominal value. However, the historic interplay between equities, on the one hand, and gold and bonds on the other, has provided an essential offset in times of market stress. The charts in Figure 3 illustrate how the different moving parts of the portfolio have functioned during past market declines (peak to trough).
Figure 3
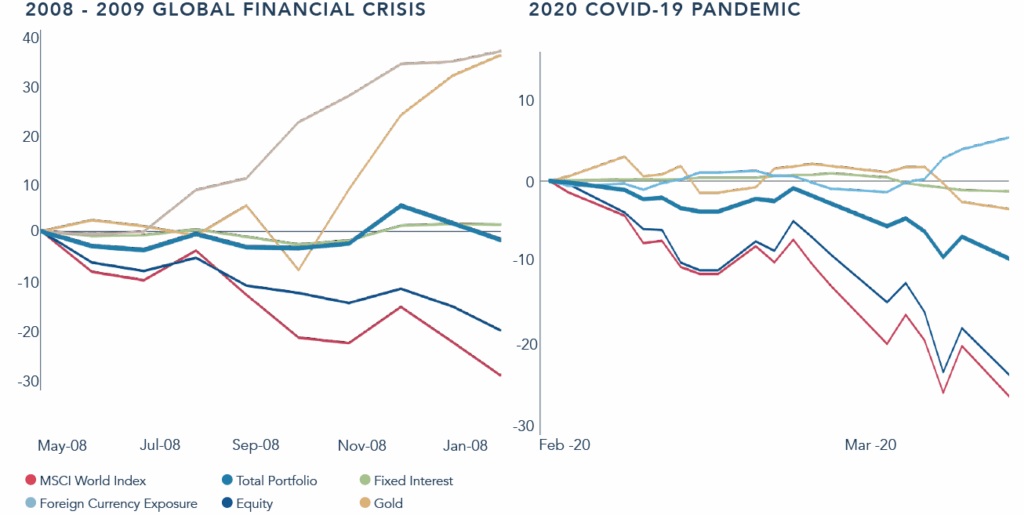
Source: FactSet, 30 June 2025, net of fees. Past performance is not a guide to future performance. All references to benchmarks are for comparative purposes only. Asset allocation subject to change. The information shown relates to a mandate which is representative of, and has been managed in accordance with, Troy Asset Management Limited’s Multi-Asset Strategy.
The other important component of our asset allocation, and which we consider separately to the decision of whether to invest in overseas securities, is currency. Our bond and equity selection is based on the underlying attractiveness of those assets regardless of the currency in which they are denominated. We then make a separate decision as to whether to retain the currency exposure or to hedge it back to the reporting currency. Where we are agnostic or negative on a currency, we will default to hedging it back. Where we believe that currency is attractively valued and provides diversification benefits, we can elect to retain all or part of the exposure. Such has been the case historically with the US dollar thanks to its negative correlation with equities during market downturns. Within the liquidity pillar, we have also held short-dated bonds in currencies that we judge to provide helpful diversification thanks to safe-haven characteristics.
We are not restricted to the asset classes above and we periodically re-examine our toolkit. If we believe another sufficiently liquid asset class will be additive to our endeavour, and we can wrap our heads around it, we will consider it for inclusion. For example, the mandate historically has invested in corporate bonds at a time in the cycle where the prospective returns were attractive. Ultimately however, equities are and will remain the primary means through which we capture the upside during bull markets. The other asset classes must earn their keep over time whilst providing helpful diversification.
Against the tide
The second common pitfall is the tendency to assume risk pro-cyclically. With this mandate it is our job to go against the grain, leaning into risk when valuations become more attractive and leaning back from risk when they rise. It is only by doing so that we can minimise the strategy’s drawdowns and be on the front foot to add to equities on weakness. Our inherent caution will lead us to generally underperform in bull markets and outperform in bear markets. We recognise that from time to time we will get it wrong and thus have internal tramlines in place to prevent us from becoming too bullish or too bearish at any point in time. Our equities have moved within an historical range of ~25-75%, averaging 42% (see Figure 4).
Figure 4 – Strategy Asset Allocation Ranges Over The Last 20 Years
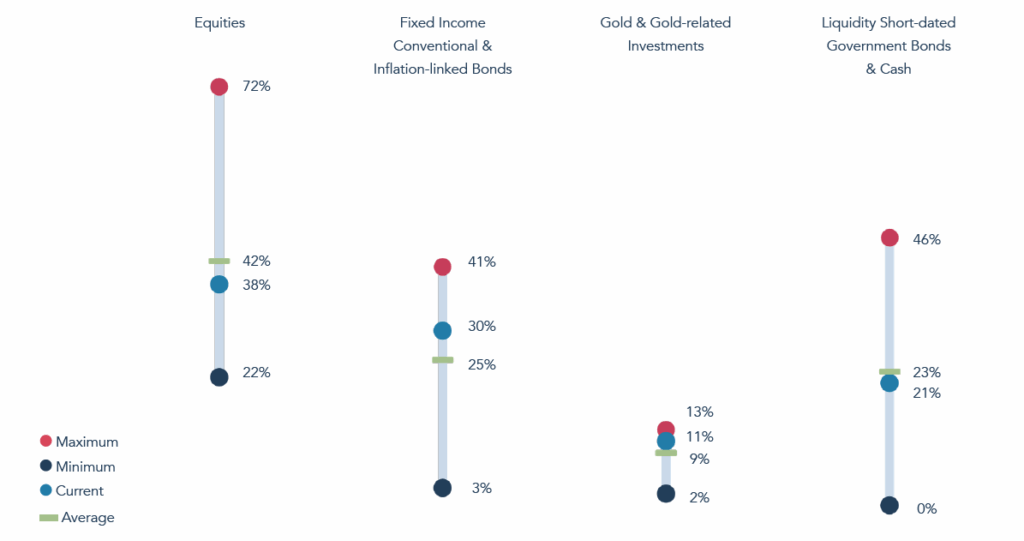
Source: Troy Asset Management Limited, 30 June 2025. Past performance is not a guide to future performance. Asset Allocation subject to change. The information shown relates to a mandate which is representative of, and has been managed in accordance with, Troy Asset Management Limited’s Multi-Asset Strategy.
The equity allocation is determined by in-depth knowledge of the companies we favour and an appraisal of their prospective returns. The multi-asset team at Troy operates alongside three fully invested equity strategies. We work as one team, collaborating on research and using the same equity framework. Whilst providing an invaluable input into our stock research, working with the wider team also provides a helpful counterweight to our mandate’s natural caution. Even when our equity allocation is towards the lower end of its range, we will continue to be engaged with those businesses that are on our watch-list but, for reasons of valuation, are not yet in the strategy. This means that we are ready to add when valuations fall, and prospective returns rise.
Our bottom-up focus on a select group of exceptional businesses also gives us the confidence to add to stocks when the macroeconomic environment is most uncertain. The resilience of these businesses and their structural ability to grow means that, at times such as Covid, we can have conviction that they will not only survive the current turmoil but will very likely emerge from it stronger than the competition. Moreover, our time horizon with each stock is long (most companies in the current portfolio have been held for at least five years), which enables us to look through short-term noise.
Our ability to invest in this way is also testament to our investor base. We are upfront about what we believe we can and cannot achieve, and about the securities we invest in. As a result, our clients have tended to be patient during periods of underperformance. Understanding of the securities we hold makes it easier to pinpoint why we get it wrong when we do. By owning exceptional businesses with multi-year tailwinds, alongside protective assets, the portfolio is structurally advantaged in a way that would be hard to achieve if we were judged against an index on a quarterly basis.
Finally, we believe that a well-defined process enables repeatability. We are conscious of the human bias to become more bearish as markets fall. To counter this, we have a clear idea of what a full weighting to equities looks like, if the companies we favour are trading on attractive valuation multiples. This acts as a roadmap. At any given moment, if a stock’s investment case is unchanged but the valuation is cheap, we must explain to ourselves why we do not have a full weighting.
Portfolio construction: protective assets
Have maximum financial flexibility to face both hazards and opportunities.
– Charlie Munger
We are doubtful of our ability to make precise forecasts about the economic cycle. When it comes to analysing protective assets, we spend our time assessing market-level risks and longer-term trends. Ultimately, we wish to understand the potential environments that could destroy capital for our investors. Current trends we observe include the ongoing shift towards a deglobalized economy and its inflationary implications, as well as historically wide fiscal deficits. This type of analysis combines with a bottom-up appraisal of prospective returns from different asset classes. These specific concerns about inflation, coupled with the risk of greater bond market volatility, have led us to identify short-duration UK and US index-linked bonds as attractive.
Given the focus on minimising drawdowns, the correlation between asset classes matters. Over the mandate’s 24-year life, correlations between equities and bonds have shifted markedly. Now, in a more inflationary environment, we are seeing them rise. This, by way of example, has fed into the reduction of our bond duration. Alongside more qualitative analysis, our Risk & Analytics team run periodic stress testing and scenario analysis of the strategy in a bid to understand the potential interplay of the portfolio’s asset classes, and exposures to risks we may not have considered. They also help us assess the potential impact of introducing a new instrument into the portfolio—most recently, the Japanese Yen. Within our equity allocation, we actively monitor the correlations between the businesses we own to ensure resilience and to avoid overexposure to any single factor. The quantitative support from our Risk & Analytics team is both proactive and responsive to requests from our team.
A key component of Troy’s governance framework is a quarterly risk discussion where the lead managers of each mandate meets with our Deputy CIO, Tom Yeowart; our Chairman, Francis Brooke; and our Head of Risk and Analytics, Graeme Bartlett. Tom brings a background in Fund research, Francis successfully led Troy’s UK Income Strategy for 17 years, and Graeme is an experienced risk management professional of over 15 years. All three are independent observers of Troy’s strategies and act as an objective sounding board, bringing fresh perspectives and challenge to Troy’s Fund Managers.
Execution: past, present and future
The strategy has experienced three major sell-offs in its lifetime. At the start of each drawdown, the strategy’s equity exposure was modest, reflective of high valuations and market expectations. As valuations fell, we meaningfully increased the equity allocation each time (see Figure 5).
Figure 5 : Dynamic Asset Allocation In Market Drawdowns
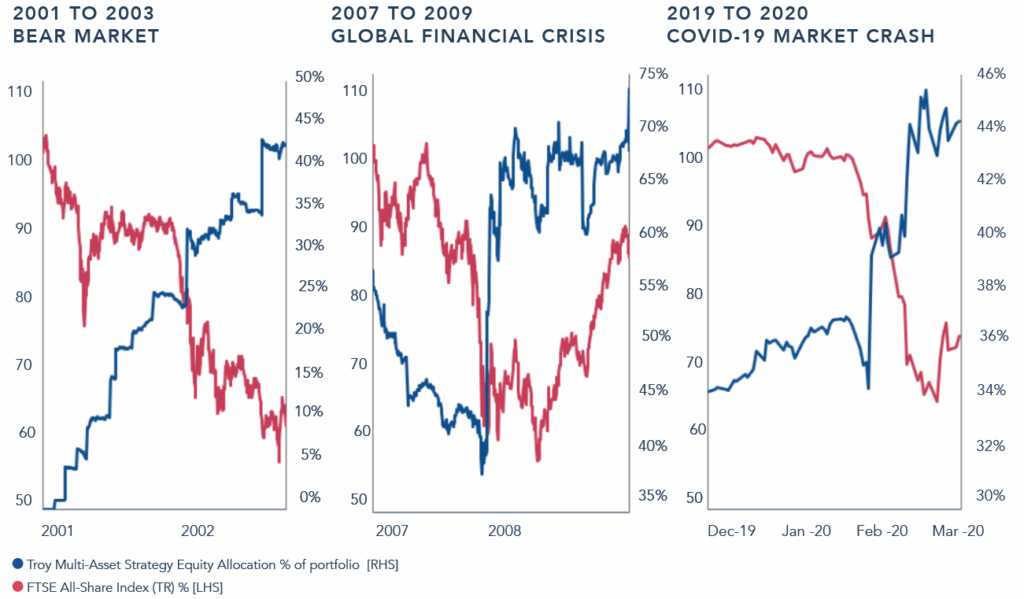
Source: Troy Asset Management Limited, 30 June 2025 . Past performance is not a guide to future performance. All references to benchmarks are for comparative purposes only. Asset Allocation and holdings subject to change. The information shown relates to a mandate which is representative of, and has been managed in accordance with, Troy Asset Management Limited’s Multi-Asset Strategy.
Most of the time, change is more incremental. From the start of 2025, we have meaningfully increased the equity allocation. The most significant step up was on the Monday following ‘Liberation Day’. We added five percentage points to equities at that point, following a sharp decline in markets. Another circa five percentage points of additions have been spread across the year, led by specific bottom-up opportunities. We have no edge in predicting the next move from the Trump administration, nor can we say with conviction whether the US will enter into a recession in the next twelve months. Rather, we remain focused on valuation levels, and what expectations are in the price for securities we understand. As at today, we are in a strong position to add further to equities should the economic outlook deteriorate.
The events since US tariff announcements, or so-called ‘Liberation Day’, have also offered important clues about the likely behaviour of protective assets going forward. Our concerns around the US dollar have led us to analyse alternative haven currencies, in addition to gold which we own already. Following this analysis, we have invested in short-dated Japanese Government bonds with the view that the yen is likely to continue to exhibit the same safe-haven properties that it has in the past.
Our purpose
The most powerful structural advantage is clarity of purpose. Although Troy’s investor base today is much broader than the single family for which Troy was first founded, the objective remains the same. Preservation of capital first, growth second. The process through which this is achieved is a balancing act, and we must not focus on one half of the equation at the expense of the other. We are conscious that we will not always get it right, and that there will be periods where being early is indistinguishable from being wrong. We believe that our equity-first framework, supported by the other three pillars of the strategy, give us the best chance of delivering the returns and profile of risk we set out to achieve.
Please refer to Troy’s Glossary of Investment terms here. The information shown relates to a mandate which is representative of, and has been managed in accordance with, Troy Asset Management Limited’s Global Equity Strategy. This information is not intended as an invitation or an inducement to invest in the shares of the relevant fund. Performance data provided is either calculated as net or gross of fees as specified in the relevant figures. Fees will have the effect of reducing performance. Please note that in addition to fees, differences between gross and net returns may be caused by different pricing and FX rate sources, and valuation timing differences. Internal gross calculations value at market close; official fund NAV values at 12PM. Past performance is not a guide to future performance. All references to benchmarks are for comparative purposes only. Overseas investments may be affected by movements in currency exchange rates. The value of an investment and any income from it may fall as well as rise and investors may get back less than they invested. Neither the views nor the information contained within this document constitute investment advice or an offer to invest or to provide discretionary investment management services and should not be used as the basis of any investment decision. There is no guarantee that the strategy will achieve its objective. The investment policy and process may not be suitable for all investors. If you are in any doubt about whether investment policy and process is suitable for you, please contact a professional adviser. References to specific securities are included for the purposes of illustration only and should not be construed as a recommendation to buy or sell these securities. This is a marketing communication document.
Although Troy Asset Management Limited considers the information included in this document to be reliable, no warranty is given as to its accuracy or completeness. The opinions expressed are expressed at the date of this document and, whilst the opinions stated are honestly held, they are not guarantees and should not be relied upon and may be subject to change without notice. Third party data is provided without warranty or liability and may belong to a third party.
Although Troy’s information providers, including without limitation, MSCI ESG Research LLC and its affiliates (the “ESG Parties”), obtain information from sources they consider reliable, none of the ESG Parties warrants or guarantees the originality, accuracy and/or completeness of any data herein. None of the ESG Parties makes any express or implied warranties of any kind, and the ESG Parties hereby expressly disclaim all warranties of merchantability and fitness for a particular purpose, with respect to any data herein. None of the ESG Parties shall have any liability for any errors or omissions in connection with any data herein. Further, without limiting any of the foregoing, in no event shall any of the ESG Parties have any liability for any direct, indirect, special, punitive, consequential or any other damages (including lost profits) even if notified of the possibility of such damages.
Issued by Troy Asset Management Limited, 33 Davies Street, London W1K 4BP (registered in England & Wales No. 3930846). Registered office: 33 Davies Street, London W1K 4BP. Authorised and regulated by the Financial Conduct Authority (FRN: 195764) and registered with the U.S. Securities and Exchange Commission (“SEC”) as an Investment Adviser (CRD: 319174). Registration with the SEC does not imply a certain level of skill or training. Any product described in this document is neither available nor offered in the USA or to U.S. Persons.
© Troy Asset Management Limited 2025.