


The worst of loans are made in the best of times.
Howard Marks
Over the past two decades, a growing share of corporate ownership and financing has moved outside public markets, beyond the daily visibility of exchange prices and regulatory scrutiny. In the 1990s there were over 8,000 US-listed companies; today there are roughly 4,000. Fewer companies list publicly, supported by a booming private equity industry that has also taken many businesses private. A parallel shift has occurred in debt markets: an increasing share of borrowing – particularly by riskier companies – now happens privately rather than via banks or public bond markets.
Troy’s Multi-Asset Strategy does not invest in private credit, so why does it matter? As investors will know, our job is to first protect capital, meaning we are always alert to emerging risks. In our experience, debt markets are rarely the sideshow to economic stress. A return to more ‘normal’ interest rates has also dramatically changed debt costs for borrowers. Our interest is especially piqued when rapid growth comes hand-in-hand with less transparency. Meanwhile, in today’s deeply interconnected global markets, we recognise that no direct exposure to private credit does not mean it cannot impact wider markets or the assets we own.
The what and why of private credit
Traditionally, a company looking to borrow money might turn to banks or, if they are a sizeable public firm, issue a bond. In both cases, banks are involved and the loan can usually be traded between a broad set of investors. Private credit offers an alternative. It is a form of ‘non-bank lending’ and has been bestowed more ominous titles such as ‘shadow banking’. But for all its labels, private credit is still just a loan, and one not made by a bank but by an investment fund.
Specialised managers – of which some larger names are Apollo, Blackstone, KKR, Ares, Blue Owl – raise capital from institutions such as pension funds, endowments, and insurers, pool it into credit funds, and lend directly to companies1. The companies pay floating interest and then the loan principal at the end of the term. Unlike bonds or syndicated bank loans, private credit is rarely traded and typically held to maturity (although we should note there are some ‘semi-liquid’ and publicly traded vehicles).
Who borrows via private credit? It was invented with small and mid-sized private companies in mind and especially those considered ‘high yield’ (also known as ‘junk’) – i.e. risky, perhaps already indebted or with low profitability. Such companies often have limited access to bank loans or ability to issue bonds. By stepping into the void, private credit has been a positive force, providing growth capital that was otherwise inaccessible. Borrowers also like the nature of the loans. Deals can be arranged much more quickly than, for example, bond issues and without the same disclosure and marketing requirements. Terms can be tailored throughout a loan’s life, and relationships between lender and borrower are close, enabling flexibility on, for example, restructurings.
From an investor’s perspective, private credit has offered something highly appealing: yield. The period following the Global Financial Crisis was characterised by persistently low interest rates and compressed returns across traditional fixed income. Private credit, operating with lighter regulation and greater flexibility, was able to charge a premium. US investment-grade bonds today yield roughly 4-5%, high-yield bonds c.6-7%, while private credit loans – typically priced at a floating rate over a benchmark2 – frequently offer yields >10%. Lenders are also lured by other enticing features. For example, the loans are not subject to capital requirements like banks’ and require minimal regulatory reporting.
Given the appeal to all parties, private credit has seen extraordinary growth. Importantly, the inverse developments in the banking sector have catalysed the rise – post-2008 reforms forced banks to hold even more capital and apply more stringent lending standards, draining their appetite for riskier borrowers. By constraining risk in one part of the system, regulators have redirected it to less visible parts of the market. We think this is significant and highlight several noteworthy features about this growing market:
1. Scale
Private credit has grown from a niche to roughly $2.0 trillion in the US and $3.5 trillion globally, likely now exceeding both US high-yield bond and leveraged loan markets. Given the low capital requirements for private credit lenders, the riskiest part of the market is increasingly supported by lenders with less capacity to absorb shocks.
Figure 1 – Private credit has gained share in the high yield credit segment
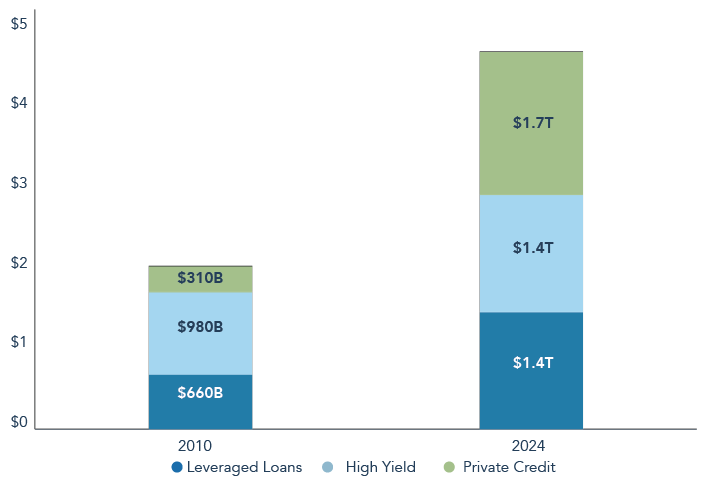
Source: Lord Abbett, Preqin, ICE Data Indices, and Credit Suisse, 30 September 2024. Most recent data available for private credit segment. High Yield is ICE BoA U.S. High Yield Index. Leveraged Loans is Credit Suisse Leveraged Loan Index. Private Credit-Preqin private credit market data.
2. Opacity and illiquidity
Opacity is a defining feature. Borrowers disclose detailed financial information only to a small number of counterparties. Loans are valued infrequently and typically by using a model (so-called ‘mark-to-model’) rather than being market priced, thus adding leverage to the financial system in less visible ways. When banks make loans, regulators see those on balance sheets and require capital against them. Private loans are distributed via investors and do not show up on any single balance sheet that is stress-tested by regulators.
The illiquidity of private credit provides stability but also suppresses visible volatility. Public bonds reprice daily as investors reassess risk. Private credit loans do not. As a result, reported returns have appeared remarkably smooth. This effect was starkly evident in 2022; while US equities, high-yield bonds, and leveraged loans delivered negative returns, a commonly cited private credit index reported a return of +6%. According to multiple benchmarks, over long periods private credit returns have comfortably exceeded public equity returns (see chart). And while default rates for high-yield bonds are typically in the range of 3-5%, private credit reports default rates closer to 2%. Some have referred to the asset class as ‘equity-like returns for debt-like risk’. In our view, these facts together naturally invite scrutiny.
Figure 2 – Returns of private credit and public equity benchmarks.
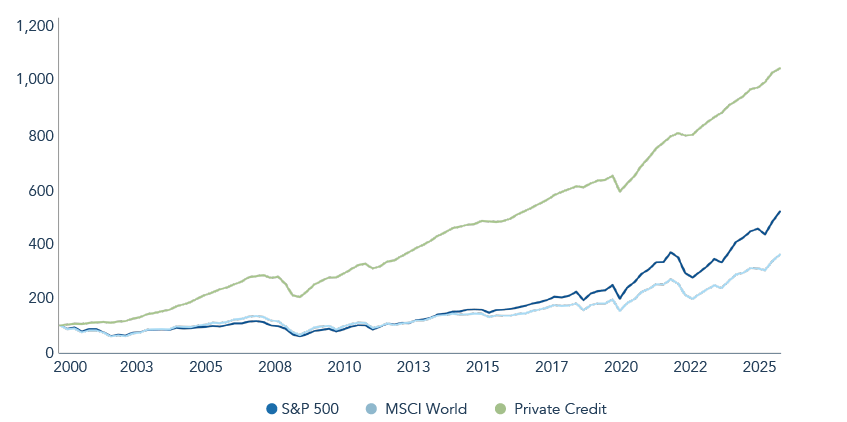
Source: Bloomberg, 31 December 2025. Past performance is not a guide to future performance. The data has been rebased to 100 as of 31 December 2000.
We think one feature driving the low defaults is the use of ‘payment in kind’ (PIK), which enables borrowers to take on more leverage in lieu of making an interest payment. While this can buy time, it also raises leverage precisely when a borrower’s financial position is deteriorating. Industry reports suggest the use of PIK has consistently risen. PIK clauses are often agreed at a loan’s outset but we note ‘bad PIK’ – a reactive arrangement made further down the line, perhaps as a borrower unexpectedly enters difficulty – has been growing in proportion.
3. Interconnectedness
“Unfortunately, it usually isn’t until after a crisis that we realize just how interconnected the different parts of the financial system were all along” – Natasha Sarin, Yale professor specialising in financial regulation.
Private credit may be distinct from traditional banking, but it is deeply embedded across the financial system. The most important link is with private equity (PE) – the largest destination for private credit loans. Around 80% of leveraged buyouts – the staple strategy for PE firms to buy companies – are likely funded today by private credit. This is no coincidence – private equity and credit entities now commonly co-exist in the same organisation. Firms realised that offering their own financing meant collecting fee income on debt that was previously paid away to banks, while also gaining more control. Private equity managers can access reliable, fast, proprietary financing, credit managers get easy access to a flow of deals, and investors can access both strategies under one roof. However, we see ample potential for conflicts of interest.
Further intrigue emerges with a third pillar – insurers. Insurance premiums, especially those for life insurance, are attractive sources of capital, being tied to long-dated, predictable liabilities and therefore well suited to long-duration investments. Realising the good fit with private credit, large operators like Apollo have pursued full or partial ownership of insurance firms, bringing the entire chain – investor, private credit manager, private equity sponsor, and borrower (PE-owned company) – under one parent company. In our view, such ‘vertical integration’ creates wide scope for poorly aligned incentives around growth and risk control. Beyond these affiliated insurers, industry adoption has been remarkable – US life insurers have allocated roughly one-third of assets to private credit. Insurers are able to hold less regulatory capital against private credit than public bonds (despite earning higher yields) prompting accusations of ‘regulatory arbitrage’.
Other familiar financial players are also present. Banks, seeking exposure, have been developing their own private credit arms as well as offering funds leverage facilities – layering leverage onto vehicles already lending to highly leveraged companies. Credit rating agencies – high profile culprits of the Global Financial Crisis – have also re-emerged. While most private credit does not require ratings, insurance-owned investments generally do. Strikingly, smaller agencies, rather than the dominant public-market “Big 3” (Moody’s, S&P, Fitch), issued 80% of these private ratings in the past year. One small firm, Egan-Jones, has faced particular scrutiny after issuing >3,600 ratings in 2024 despite employing only c.20 credit analysts.
Two high profile bankruptcies – First Brands Group and Tricolor – late last year highlighted lurking risks and interconnections. First Brands, a group of auto parts supply companies, went bust in September disclosing liabilities estimated in the wide range of $10-50bn (see Figure 3 of an email exchange between counsels, showing one example of assets unaccounted for). The company created enormously complex corporate structures, including off-balance sheet vehicles, to conceal the extent of borrowing, much of it tied to private credit. Alongside specialist private credit firms, global banks Jefferies and UBS are nursing hundreds of millions in losses. Moody’s and S&P were also present, providing credit ratings on the company that proved far too optimistic. While fraud played a key role and the case should not be over-extrapolated, it illustrates how risk can accumulate in opaque areas of the market. As J. P. Morgan CEO Jamie Dimon remarked following the Tricolor collapse, to which his bank was exposed, “when you see one cockroach, there are probably more”.
Figure 3 – First Brands Group (FBG) email exchange

Source: The Financial Times, September 2025.
4. Concentration
Finally, we note that much of private credit has been funnelled into the IT sector, including the massive data centre build-out supporting the generative AI boom. Morgan Stanley thinks c.$3 trillion in capex is required over 2025-2028, but only about half can be funded with the free cash generated by profitable ‘hyperscalers’3 such as Alphabet and Microsoft. Debt markets will need to fill the $1.5tr gap and private credit is expected to produce the majority.
Last year, reports noted Meta was set to record the largest ever private credit deal – $29bn in data centre financing, structured to sit off their balance sheet. CoreWeave, a startup that leases data centres, fills them with Graphical Processing Units (GPUs), then rents the capacity to AI companies, has raised c.$14bn in debt, much of it private credit. The company generated c.$5bn in revenue last year with large losses and faces $34bn in lease payments between 2025-2028. CoreWeave is using its loans to buy GPUs while simultaneously using GPUs as collateral. Perhaps 70% of CoreWeave’s revenue comes from Microsoft. Nvidia supplies CoreWeave’s GPUs while being one of its major investors, meaning CoreWeave is using Nvidia’s money to buy Nvidia’s chips and then renting usage back to Nvidia. We are as confused as you are!
Figure 4 – Private Credit Sector Allocation, by Last Three-Year Deal Volume (percent share by global deal volume).
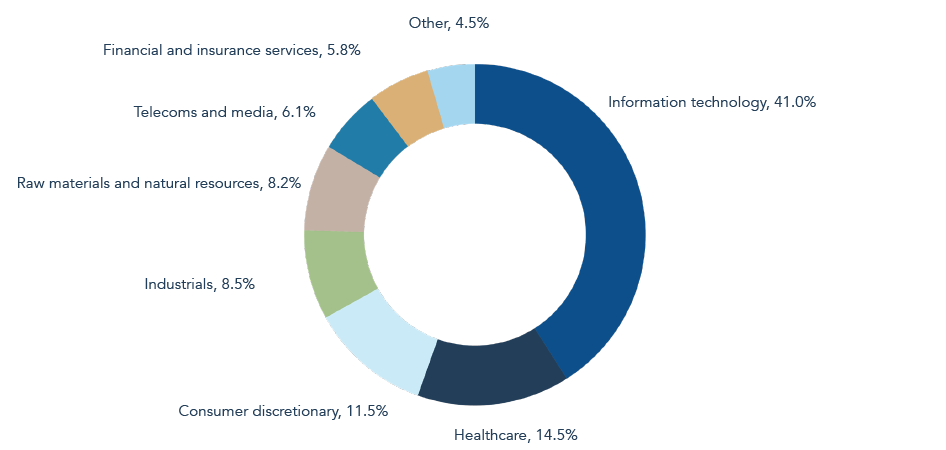
Source: IMF Global Financial Stability Report, April 2024.
Concluding thoughts
We felt compelled to write this paper through a growing appreciation of the scale and interconnectedness of private credit, particularly as it has collided with the AI investment boom alongside a historically concentrated and highly valued US equity market. Even if some of the largest players are not directly part of the private credit complex, we see potential for sentiment and liquidity risks to spill over to wider markets. Indeed, if investors do start to worry about AI, or private credit, or something else, it is their more liquid assets, such as listed equities, that they may rush to sell first. We would highlight that the few parts of the private credit market offering semi-liquid or publicly traded vehicles have recently seen selling pressure rise notably.
Private credit performs a valuable role and will likely remain central to capital markets. But paths are not always smooth where financial ‘innovation’, abundance, and light oversight meet. Many of the newly minted billionaires from the rise of private credit cut their teeth in the ‘junk bond’ era of the late 1980s. Market historians will know that period did not end well. That said, it was also not terminal and from the ashes rose a healthier and much larger high-yield (junk bond) market. Private credit is here to stay, but we feel there are enough facts, figures, and anecdotes to suggest the journey may not be an uninterrupted unstoppable rise.
All these considerations contribute to our cautious market view, as expressed in the strategy’s moderate equity exposure alongside meaningful allocations to short-duration fixed income and gold. We are not going to own private credit. As ever, we look to invest in liquid, transparent, and proven assets, providing not only some comfort on the risks at stake but also the flexibility to rapidly adjust asset allocation if market ructions emerge.
- There are many structures and variations of private credit loans but we focus on the simplest and most common. ↩︎
- For the US, typically SOFR (Secured Overnight Financing Rate). ↩︎
- Hyperscalers are massive cloud service providers that offer immense, scalable computing, storage and networking capabilities to businesses on demand. ↩︎
Disclaimer
Please refer to Troy’s Glossary of Investment terms here.
The information shown relates to a mandate which is representative of, and has been managed in accordance with, Troy Asset Management Limited’s Multi-asset Strategy. This information is not intended as an invitation or an inducement to invest in the shares of the relevant fund. Performance data provided is either calculated as net or gross of fees as specified. Fees will have the effect of reducing performance. Past performance is not a guide to future performance. All references to benchmarks are for comparative purposes only. Overseas investments may be affected by movements in currency
exchange rates. The value of an investment and any income from it may fall as well as rise and investors may get back less than they invested. Neither the views nor the information contained within this document constitute investment advice or an offer to invest or to provide discretionary investment management
services and should not be used as the basis of any investment decision. There is no guarantee that the strategy will achieve its objective. The investment policy and process may not be suitable for all investors. If you are in any doubt about whether investment policy and process is suitable for you, please contact
a professional adviser. References to specific securities are included for the purposes of illustration only and should not be construed as a recommendation to buy or sell these securities.
Although Troy Asset Management Limited considers the information included in this document to be reliable, no warranty is given as to its accuracy or completeness. The opinions expressed are expressed at the date of this document and, whilst the opinions stated are honestly held, they are not guarantees
and should not be relied upon and may be subject to change without notice. Third party data is provided without warranty or liability and may belong to a third party.
Although Troy’s information providers, including without limitation, MSCI ESG Research LLC and its affiliates (the “ESG Parties”), obtain information from sources they consider reliable, none of the ESG Parties warrants or guarantees the originality, accuracy and/or completeness of any data herein. None of the
ESG Parties makes any express or implied warranties of any kind, and the ESG Parties hereby expressly disclaim all warranties of merchantability and fitness for a particular purpose, with respect to any data herein. None of the ESG Parties shall have any liability for any errors or omissions in connection with any data herein. Further, without limiting any of the foregoing, in no event shall any of the ESG Parties have any liability for any direct, indirect, special, punitive, consequential or any other damages (including lost profits) even if notified of the possibility of such damages.
All references to FTSE indices or data used in this presentation is © FTSE International Limited (“FTSE”) 2025. ‘FTSE ®’ is a trade mark of the London Stock Exchange Group companies and is used by FTSE under licence.
Issued by Troy Asset Management Limited, 33 Davies Street, London W1K 4BP (registered in England & Wales No. 3930846). Registered office: 33 Davies Street, London W1K 4BP. Authorised and regulated by the Financial Conduct Authority (FRN: 195764) and registered with the U.S. Securities and Exchange Commission (“SEC”) as an Investment Adviser (CRD: 319174). Registration with the SEC does not imply a certain level of skill or training. Any fund described in this document is neither available nor offered in the USA or to U.S. Persons.
© Troy Asset Management Limited 2026.